

Welcome to this weekly housing trends update, where we bring you the latest snapshot of inventory trends, listing activity, and buyer-seller dynamics across the U.S. housing market.
In addition to our monthly housing trends reports, which offer deeper insights into long-term patterns, we publish these weekly updates to provide more timely views into market changes. This effort began in response to the rapid shifts in the economy and housing landscape.
You can count on a new Weekly Housing Trends Update, fresh weekly data each Thursday, and a weekly video from our economists to help you stay informed.
What this week’s data shows
This week, we see a continuation of recent trends: New listings are rising, inventory is rebounding, and prices are holding steady—making today’s market more buyer-friendly than a year ago. Consumer confidence is also increasing. Buyer and seller sentiment have improved, and concerns about job security and personal finances have eased.
Looking ahead, given the cooler-than-expected inflation and overall healthy labor market, the Federal Reserve is expected to keep rates unchanged this week. As a result, elevated mortgage rates will continue to pose challenges to homebuyers.
Weekly housing trends highlights
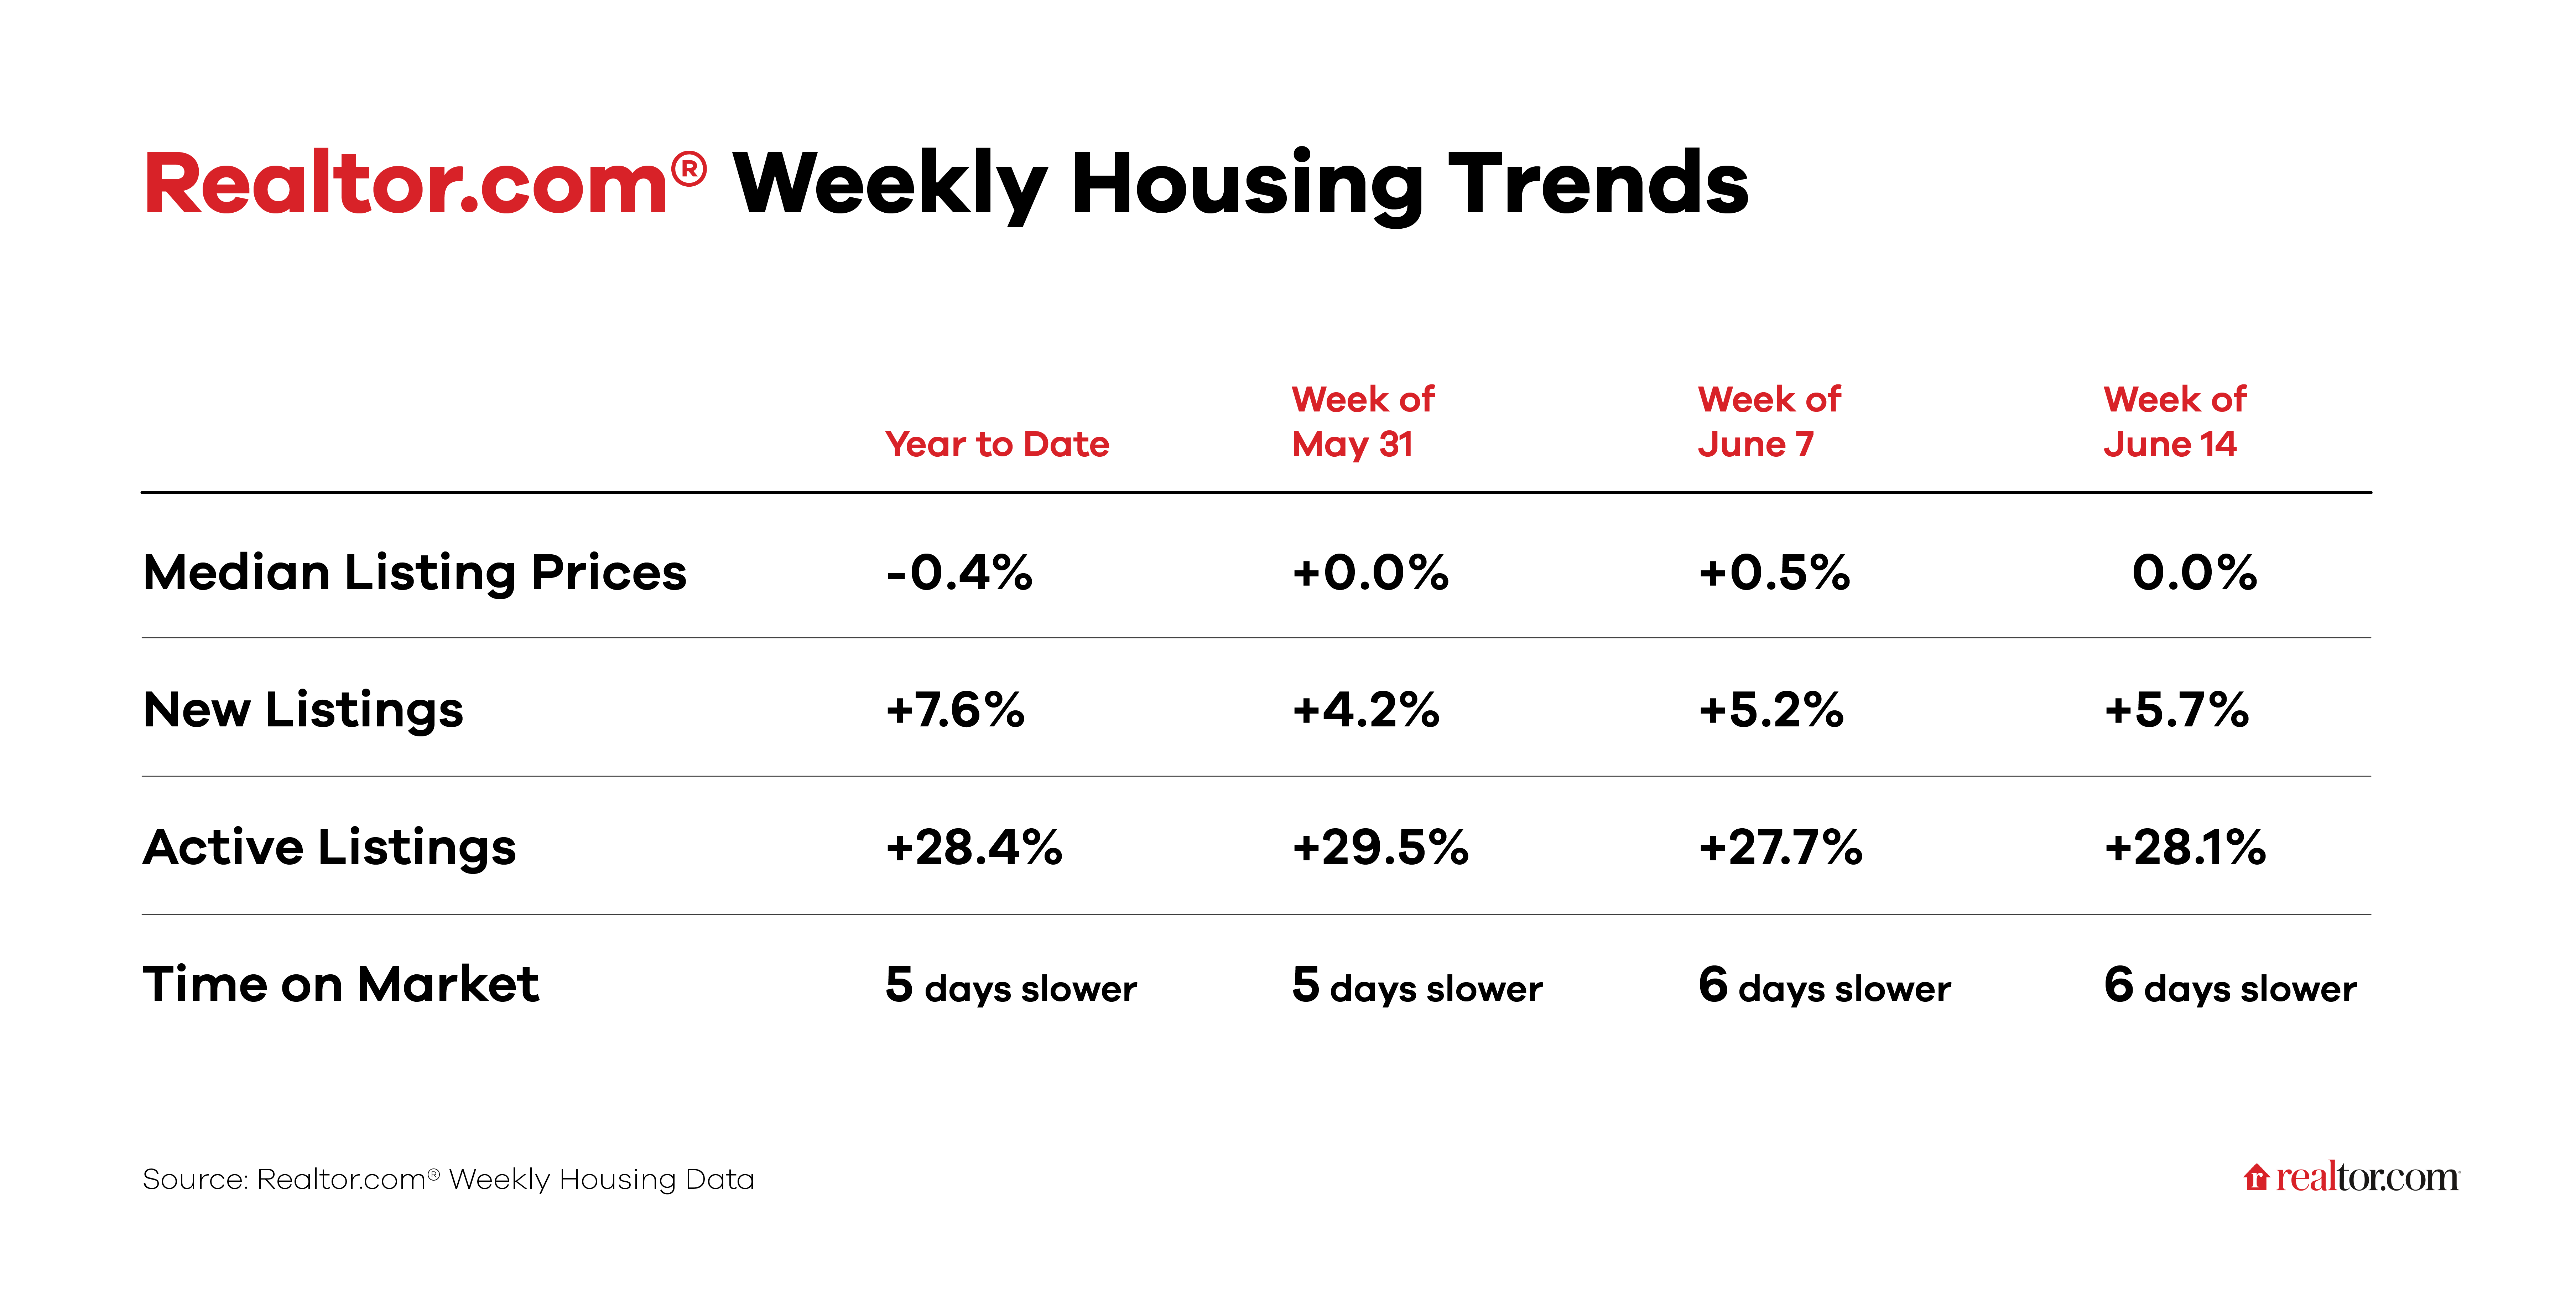
- New listings—a measure of sellers putting homes up for sale—rose 5.7% year over year
New listings rose again last week on an annual basis, up 5.7% compared with the same period last year, a slightly faster growth compared with the previous two weeks. Recent increases in new listings, coupled with rising active inventory, are a welcome sign for buyers, who are poised to gain some negotiating power as they move into the summer months. Despite fresh inventory, buyers still face affordability challenges of high prices and mortgage rates, which continue to dampen activity. - Active inventory climbed 28.1% year over year
The number of homes actively for sale remains on a strong upward trajectory, now 28.1% higher than this time last year. This represents the 84th consecutive week of annual gains in inventory. There were more than 1 million homes for sale again last week, marking the seventh week in a row over the threshold and the highest inventory level since December 2019. While choices for buyers have expanded, overall supply remains well below pre-pandemic norms, particularly in the Midwest and Northeast, where the nation’s greatest housing supply gaps persist. Meanwhile, nearly all major Southern metros now exceed pre-COVID-19 active inventory, fueled by faster new construction over the past several years. - Homes spent six days longer on the market than a year ago
Market pace continues to ease annually, with the typical home spending six more days on the market compared with last year. Median time on the market now sits at 51 days nationally, about the same as pre-pandemic norms for June. For reference, when supply was at its tightest in spring 2022, median time on the market was as low as 28 days. - The median list price was unchanged year over year
The median list price was flat (0% change) year over year this week and is down 0.4% year to date. The median list price per square foot—which adjusts for changes in home size—rose 0.7% year over year. With inventory growing and 1 in 5 sellers slashing prices, the pendulum is swinging back toward a balanced market, as price growth slows and buyers gain more leverage.

