

- US NFP beats at 177K, but Fed seen delivering only three cuts instead of four.
- DXY drops 0.58% to 99.59, fueling demand for risk-sensitive currencies like the Aussie.
- Traders favor AUD as risk appetite improves and US policy outlook remains data-dependent.
The Australian Dollar surged to a new year-to-date (YTD) high of 0.6469, gaining over 1.20% following a strong jobs report in the United States (US) that suggested the economy remains solid.
AUD/USD jumps 1.20% to 0.6469 as Dollar weakens on shifting Fed rate cut bets and upbeat risk sentiment
Nonfarm Payroll figures in April rose by 177K, up from 130K projected, and trailed March’s downward revised 185K numbers. The Unemployment Rate was unchanged as expected at 4.2% and reaffirms the Federal Reserve’s (Fed) posture of waiting for the hard data to dictate monetary policy.
Hence, traders who expected four rate cuts according to the Fed Funds rates futures now expect three.
Despite the strong data, the Aussie Dollar is also rising as the US Dollar Index (DXY) tumbles. The DXY who tracks the performance of the American Dollar against a basket of six peers, is down 0.58% at 99.59.
AUD/USD Price Chart – Daily
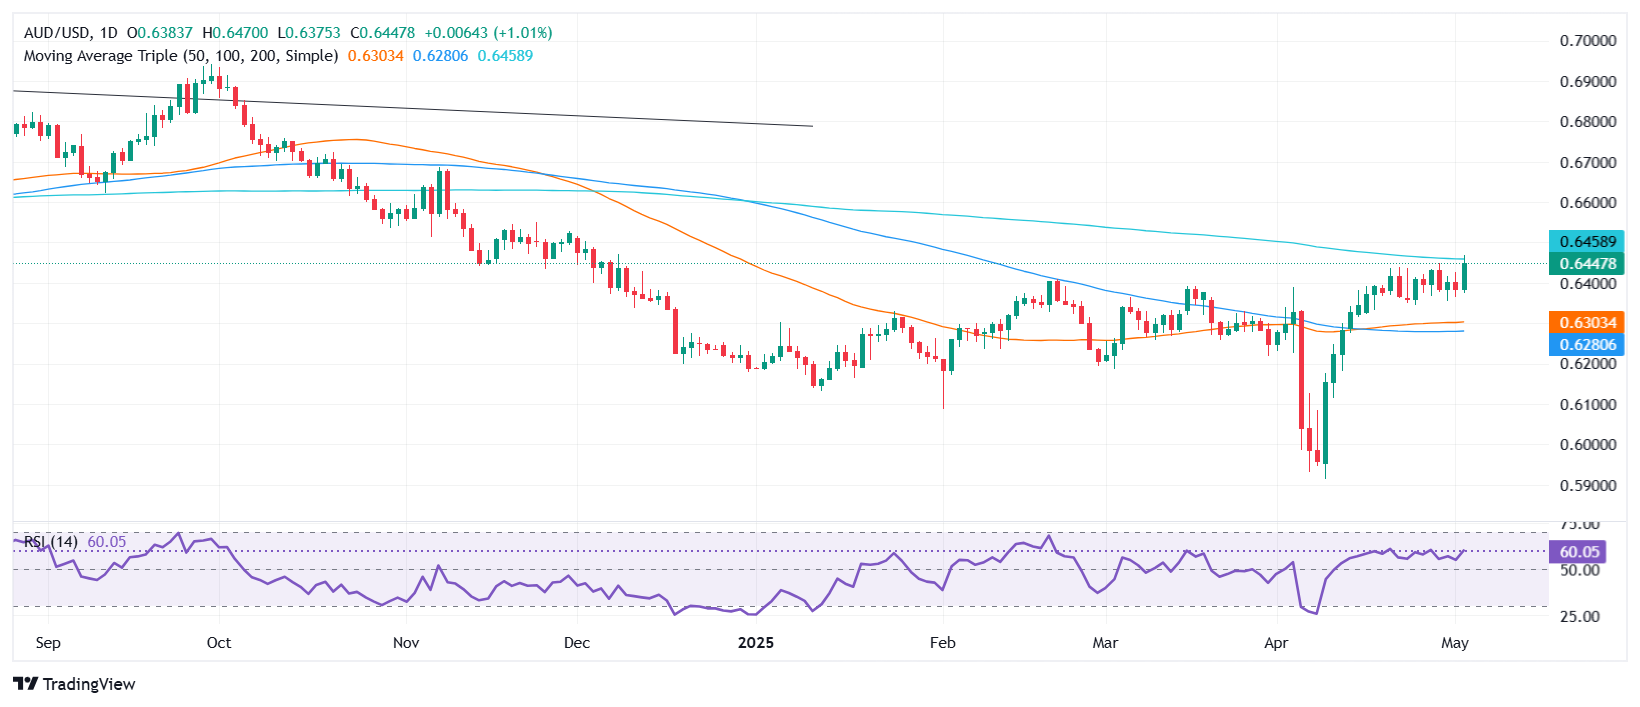
Although hitting new yearly highs, traders should know that the 200-day Simple Moving Average (SMA) at 0.6461 is the first resistance level. A decisive break will expose the 0.6500 figure and the November 25 peak at 0.6549. Failure at the 200-day SMA would exacerbate a pullback toward 0.6400 and lower the exchange rate.
Australian Dollar PRICE This year
The table below shows the percentage change of Australian Dollar (AUD) against listed major currencies this year. Australian Dollar was the strongest against the US Dollar.
| USD | EUR | GBP | JPY | CAD | AUD | NZD | CHF | |
|---|---|---|---|---|---|---|---|---|
| USD | -8.65% | -5.84% | -8.24% | -4.16% | -3.99% | -6.08% | -9.02% | |
| EUR | 8.65% | 3.13% | 0.54% | 5.00% | 5.14% | 2.90% | -0.32% | |
| GBP | 5.84% | -3.13% | -2.50% | 1.83% | 1.95% | -0.22% | -3.34% | |
| JPY | 8.24% | -0.54% | 2.50% | 4.45% | 4.65% | 2.38% | -0.82% | |
| CAD | 4.16% | -5.00% | -1.83% | -4.45% | 0.07% | -2.02% | -5.08% | |
| AUD | 3.99% | -5.14% | -1.95% | -4.65% | -0.07% | -2.12% | -5.17% | |
| NZD | 6.08% | -2.90% | 0.22% | -2.38% | 2.02% | 2.12% | -3.13% | |
| CHF | 9.02% | 0.32% | 3.34% | 0.82% | 5.08% | 5.17% | 3.13% |
The heat map shows percentage changes of major currencies against each other. The base currency is picked from the left column, while the quote currency is picked from the top row. For example, if you pick the Australian Dollar from the left column and move along the horizontal line to the US Dollar, the percentage change displayed in the box will represent AUD (base)/USD (quote).
Information on these pages contains forward-looking statements that involve risks and uncertainties. Markets and instruments profiled on this page are for informational purposes only and should not in any way come across as a recommendation to buy or sell in these assets. You should do your own thorough research before making any investment decisions. FXStreet does not in any way guarantee that this information is free from mistakes, errors, or material misstatements. It also does not guarantee that this information is of a timely nature. Investing in Open Markets involves a great deal of risk, including the loss of all or a portion of your investment, as well as emotional distress. All risks, losses and costs associated with investing, including total loss of principal, are your responsibility. The views and opinions expressed in this article are those of the authors and do not necessarily reflect the official policy or position of FXStreet nor its advertisers. The author will not be held responsible for information that is found at the end of links posted on this page.
If not otherwise explicitly mentioned in the body of the article, at the time of writing, the author has no position in any stock mentioned in this article and no business relationship with any company mentioned. The author has not received compensation for writing this article, other than from FXStreet.
FXStreet and the author do not provide personalized recommendations. The author makes no representations as to the accuracy, completeness, or suitability of this information. FXStreet and the author will not be liable for any errors, omissions or any losses, injuries or damages arising from this information and its display or use. Errors and omissions excepted.
The author and FXStreet are not registered investment advisors and nothing in this article is intended to be investment advice.

